Every year Dimensional Fund Advisors (DFA) produces a huge study of Mutual Funds and ETFs call the Fund Landscape. The entire report is available here and I am going to save you a ton of time by giving you the high level executive summary.
From a performance point of view, fund performance is judged not by their absolute performance but by comparing them to a benchmark that most closely matches the fund’s goal. If they match or exceed the benchmark, that’s success. It’s important to note that the securities in the benchmarks are known - they are not secrets! Why couldn’t a fund manager copy the benchmark, then, using their expertise, make a few swaps and then “win”. Very few seem to be able to do that; it demonstrates just how difficult it is to “pick winners”.
It’s a revealing study. DFA doesn’t single out their own funds, (I assume compliance is the reason) but as you might imagine, their funds are at or near the top in every category which is why we use them. Be glad to share details with you.
It’s important to note the statistics of stock market data. Because of the significant “noise” in stock market data, sample size must be huge to make believable conclusions or statements. That’s why DFA includes data going back 20 years. When you look at this data, focus in on the 20 year data.
Here are the key takeaways - all of these are 20 years data points for the reasons mentioned above, but know that the 10 and 15 year results are similar:
Stock: only 55% of the funds even exist, 12% exceed their benchmarks. (Bond fund numbers are 46% and 17% respectively.)
How many funds can continue exceeding their benchmark over 5 years - averages for stock and bonds are 23% and 34%.
There is a relationship to the internal fund expense and performance. The lower the fees, the greater likelihood of success. (See image below.)
The same is true of turnover - the greater the turnover, the LESS likelihood of success. (See image below.)
See my commentary below.
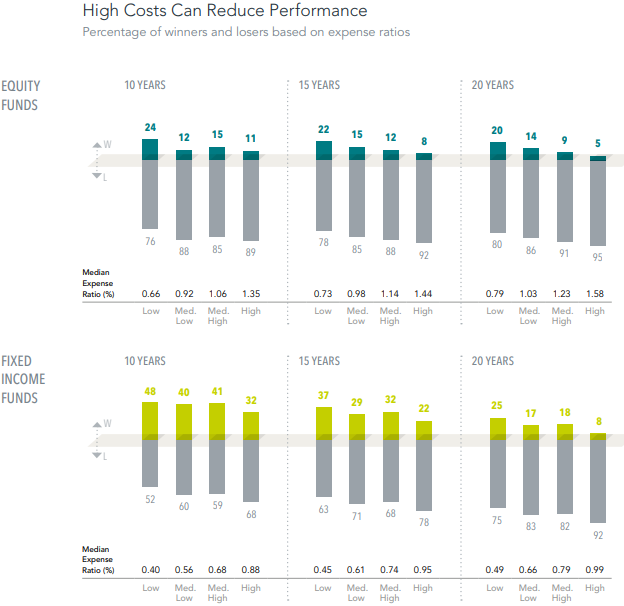
The sample includes US-domiciled funds at the beginning of the 10-, 15-, and 20-year periods ending December 31, 2025. Funds are sorted into quartiles within their category based on average expense ratio over the sample period. The chart shows the percentage of winner and loser funds by expense ratio quartile for each period. Winners are funds that survived and outperformed their benchmark over the period. Losers are funds that either did not survive or did not outperform their respective benchmark. High Costs Can Reduce Performance. Percentage of winners and losers based on expense ratios Past performance is no guarantee of future results. See The Fund Landscape Appendix for more information. US-domiciled mutual funds and US-domiciled ETFs are not generally available for distribution outside the US.
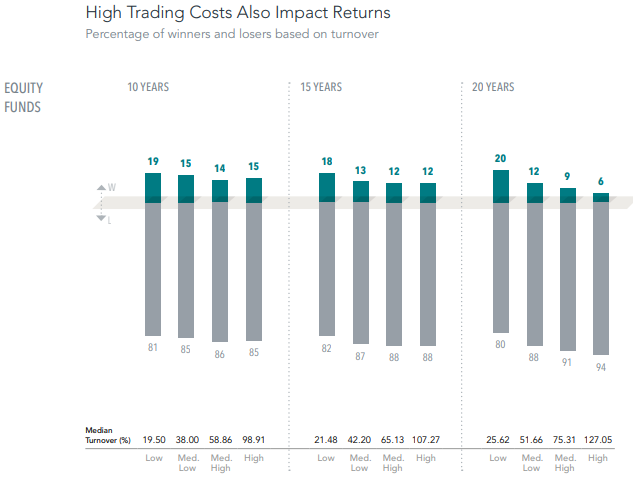
The sample includes US-domiciled equity funds at the beginning of the 10-, 15-, and 20-year periods endingDecember 31, 2025. Funds are sorted into quartiles within their category based on average turnover during the sample period. The chart shows the percentage of winner and loser funds by turnover quartile for each period. Winners are funds that survived and outperformed their benchmark over the period. Losers are funds that either did not survive or did not outperform their respective benchmark.
Commentary
Many of the so-called experts lack discipline just like most individual investors who try this on their own.
Many of the experts are applying short term strategies on what is actually a long term effort. That’s a mismatch which explains their overall failure.
If you want to vary from the starting point of owning most of the market, use long term data that discovers long term winning strategies (since this is a long term game) and use that strategy for a portion of your investments. (That’s what DFA does at the fund level and what we do for you at the portfolio level.)
Most of the experts are not in tune with basic statistics and can’t recognize the difference between short term data noise and actual long term conclusions.
What about “indexing”? Think of Vanguard. Indexing actually copies the benchmark. But the benchmark has zero fees. So indexing will fall short of their benchmark 100% of the time. However, they come very close each time, and that beats a large percentage of the competitors. DFA takes it one step further and is not constrained to copy the benchmark.
The Fund Landscape Appendix .
Data Sample The sample includes US-domiciled, USD-denominated open-end and exchange-traded funds (ETFs) in the following Morningstar categories. Non-Dimensional fund data provided by Morningstar. Dimensional fund data is provided by the fund accountant. Dimensional funds or subadvised funds whose access is or previously was limited to certain investors are excluded. Index funds, load-waived funds, and funds of funds are excluded from the industry sample. Methodology The beginning samples include funds as of the start of each respective time period. Surviving funds are those with return observations for every month of the sample period. Each fund is evaluated relative to its primary prospectus benchmark. Where the full series of primary prospectus benchmark returns is unavailable, non-Dimensional funds are instead evaluated relative to their Morningstar category index. Outperformers are funds that survived the sample period and whose cumulative net return over the period exceeded that of their respective benchmark. We aggregate funds with multiple share classes to the strategy level. Morningstar Categories (Equity) Equity fund sample includes the following Morningstar historical categories: Diversified Emerging Markets, Europe Stock, Foreign Large Blend, Foreign Large Growth, Foreign Large Value, Foreign Small/Mid Blend, Foreign Small/Mid Growth, Foreign Small/Mid Value, Global Real Estate, Japan Stock, Large Blend, Large Growth, Large Value, Mid-Cap Blend, Mid-Cap Growth, Mid-Cap Value, Miscellaneous Region, Pacific/Asia ex-Japan Stock, Real Estate, Small Blend, Small Growth, Small Value, Global Large-Stock Blend, Global Large-Stock Growth, Global Large-Stock Value, and Global Small/Mid Stock. Morningstar Categories (Fixed Income) Fixed income fund sample includes the following Morningstar historical categories: Corporate Bond, High Yield Bond, Inflation-Protected Bond, Intermediate Core Bond, Intermediate Core-Plus Bond, Long-Term Bond, Intermediate Government, Long Government, Muni California Intermediate, Muni California Long, Muni Massachusetts, Muni Minnesota, Muni National Intermediate, Muni National Long, Muni National Short, Muni New Jersey, Muni New York Intermediate, Muni New York Long, Muni Ohio, Muni Pennsylvania, Muni Single State Intermediate, Muni Single State Long, Muni Single State Short, Muni Target Maturity, Short Government, Short-Term Bond, Short-Term Inflation-Protected Bond, Target Maturity, Ultrashort Bond, Global Bond, and Global Bond-USD Hedged. Index Data Sources Index data provided by Bloomberg, MSCI, Russell, FTSE Fixed Income LLC, and S&P Dow Jones Indices LLC. Bloomberg data provided by Bloomberg. MSCI data © MSCI 2026, all rights reserved. Frank Russell Company is the source and owner of the trademarks, service marks, and copyrights related to the Russell Indexes. FTSE fixed income indices © 2026 FTSE Fixed Income LLC. All rights reserved. S&P data © 2026 S&P Dow Jones Indices LLC, a division of S&P Global. All rights reserved. Indices are not available for direct investment. Their performance does not reflect the expenses associated with management of an actual portfolio. US-domiciled mutual funds and US-domiciled ETFs are not generally available for distribution outside the US. Mutual fund investment values will fluctuate, and shares, when redeemed, may be worth more or less than original cost. Diversification neither assures a profit nor guarantees against a loss in a declining market. There is no guarantee investment strategies will be successful. Past performance is no guarantee of future results. ETFs trade like stocks, fluctuate in market value, and may trade either at a premium or a discount to their net asset value. ETF shares trade at market price and are not individually redeemable with the issuing fund, other than in large share amounts called creation units. ETFs are subject to risks similar to those of stocks, including those regarding short-selling and margin account maintenance. Brokerage commissions and expenses will reduce returns. RISKS Investments involve risks. The investment return and principal value of an investment may fluctuate so that an investor’s shares, when redeemed, may be worth more or less than their original value. Diversification neither assures a profit nor guarantees against a loss in a declining market. Past performance is not a guarantee of future results. There is no guarantee strategies will be successful. UNITED STATES Dimensional Fund Advisors LP is an investment advisor registered with the Securities and Exchange Commission. Investment products: • Not FDIC Insured • Not Bank Guaranteed • May Lose Value Dimensional Fund Advisors does not have any bank affiliates. CANADA Published February 2026. These materials have been prepared by Dimensional Fund Advisors Canada ULC, manager of the Dimensional funds. This information is provided for educational purposes only and should not be construed as investment advice or an offer of any security for sale. The information provided in this presentation has been compiled from sources believed to be reliable and current, but accuracy should be placed in the context of the underlying assumptions. Commissions, trailing commissions, management fees, and expenses all may be associated with investment funds. Please read the prospectus before investing. Indicated rates of return include historical annual compounded total returns that reflect changes in value and reinvestment of all dividends and do not take into account sales, redemption, distribution, or optional charges or income taxes payable by any security holder that would have reduced returns. Investment funds are not guaranteed, their values change frequently, and past performance may not be repeated. To obtain further information regarding the Dimensional funds, please visit ca.dimensional.com.