Content courtesy of Dimensional Fund Advisors
Many people start out managing their own investments. But as their earnings and assets grow, their financial needs and challenges become more complex—and continuing to go it alone could prove costly in terms of investing miscues. Consider three common mistakes that can reduce returns and increase anxiety:
1. Trying to Time the Market
Investors may be tempted to cash out of the stock market to avoid a predicted downturn. But accurately forecasting the market’s direction to time when to buy and sell is a guessing game. Missing only a brief period of strong market performance can drastically affect your lifetime wealth.
For example, the chart below shows a hypothetical investment in the Russell 3000 Index, a broad US stock market benchmark. Over the entire 25-year period ending December 31, 2023, a $1,000 investment in 1999 turned into $6,449. But what if you pulled your cash out at the wrong time? Missing the best week, month, three months, or six months would have significantly reduced the growth of your investment.
The Cost of Missing the Best Consecutive Days
Russell 3000 Index total return, 1999-2023

Past performance is no guarantee of future results. Indices are not available for direct investment. Their performance does not reflect the expenses associated with the management of an actual portfolio. In USD. For illustrative purposes. Best performance dates represent end of period (November 28, 2008, for best week; April 22, 2020, for best month; June 22, 2020, for best three months; and September 4, 2009, for best six months). The missed best consecutive days examples assume that the hypothetical portfolio fully divested its holdings at the end of the day before the missed best consecutive days, held cash for the missed best consecutive days, and reinvested the entire portfolio in the Russell 3000 Index at the end of the missed best consecutive days. Data presented in the growth of $1,000 exhibit is hypothetical and assumes reinvestment of income and no transaction costs or taxes. The data is for illustrative purposes only and is not indicative of any investment. Frank Russell Company is the source and owner of the trademarks, service marks, and copyrights related to the Russell Indexes.
2. Focusing on the Headlines
Investors may become enamored with popular stocks based on recent performance or media attention—and overconcentrate their portfolio holdings in these companies. One example is the rise of the large US technology companies known as the Magnificent 7 (Alphabet, Amazon, Apple, Meta Platforms, Microsoft, NVIDIA, and Tesla). But the chart below shows that many fast-growing stocks have stopped outperforming after becoming one of the 10 largest stocks in the US. On average, companies that outperformed the market on the way up failed to outperform in the years after making the Top 10 list.
Stocks on the Way Up, and After
Average annualized outperformance of companies before and after the year they became one of the 10 largest in the US, 1927-2023

Past performance is no guarantee of future results. This information is intended for educational purposes and should not be considered a recommendation to buy or sell a particular security. As compared to Fama/French Total US Market Research Index. In USD. Source: Dimensional, using data from CRSP. Includes all US common stocks excluding REITs. Largest stocks are identified at the end of each calendar year by sorting eligible US stocks on market capitalization. The market is represented by the Fama/French Total US Market Research Index. The 10 largest companies are identified by market capitalization. Returns after joining the 10 largest are measured as of the start of the first calendar year after a stock joins the Top 10. Annualized excess return is the difference in annualized compound returns between the stock and the market over the three-, five-, and 10-year periods, before and after each stock’s initial year-end classification in the Top 10. Three-, five-, and 10-year annualized returns are computed for companies with return data available for the entire three-, five-, and 10-year periods, respectively. The number of firms included in measuring excess returns prior (subsequent) to becoming a Top 10 stock consists of 44 (56) for the three-year period, 43 (54) for the five-year period, and 35 (49) for the 10-year period.
The lesson? Rather than loading up on a handful of stocks that have dominated the market, you can own many stocks through mutual funds or ETFs. Diversifying across industries and global markets can help reduce overall risk and position investors to potentially capture the returns of future top-performing companies.
3. Chasing Past Performance
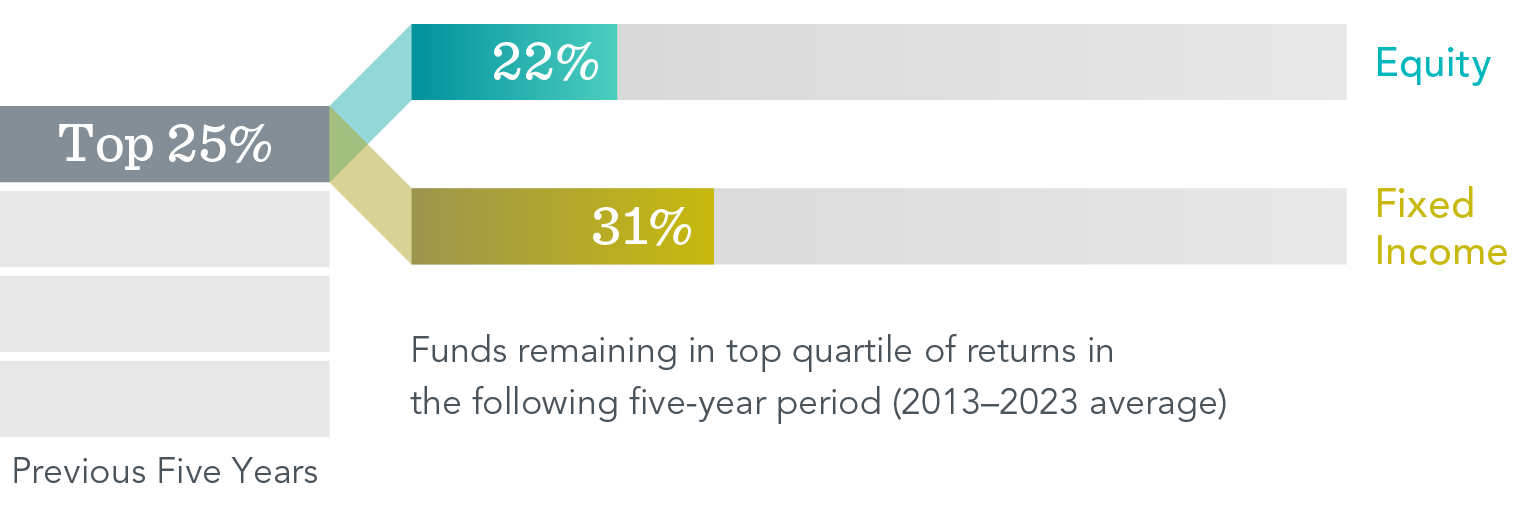
You might be inclined to select investments based on past returns, expecting top-ranked funds to continue delivering the best performance. But can they maintain that outperformance? Research shows that most funds ranked in the top 25% based on five-year returns didn’t remain in the top 25% in the next five years. In fact, only about one in five equity funds stayed in the top-performing group, and only about a third of fixed income funds did. The lesson? A fund’s past performance offers limited insight into its future returns.
Percentage of Top-Ranked Funds that Stayed on Top
Past performance is no guarantee of future results. Global Large-Stock Growth, Global Large-Stock Value, and Global Small/Mid Stock.
Morningstar Categories (Fixed Income)
Fixed income fund sample includes the following Morningstar historical categories: Corporate Bond, High-Yield Bond, Inflation-Protected Bond, Intermediate Core Bond, Intermediate Core-Plus Bond, Intermediate Government, Long Government, Muni California Intermediate, Muni California Long, Muni Massachusetts, Muni Minnesota, Muni National Intermediate, Muni National Long, Muni National Short, Muni New Jersey, Muni New York Intermediate, Muni New York Long, Muni Ohio, Muni Pennsylvania, Muni Single State Intermediate, Muni Single State Long, Muni Single State Short, Muni Target Maturity, Short Government, Short-Term Bond, Ultrashort Bond, Global Bond, and Global Bond-USD Hedged.
Index Data Sources
Index data provided by Bloomberg, MSCI, Russell, FTSE Fixed Income LLC, and S&P Dow Jones Indices LLC. Bloomberg data provided by Bloomberg. MSCI data © MSCI 2024, all rights reserved. Frank Russell Company is the source and owner of the trademarks, service marks, and copyrights related to the Russell Indexes. FTSE fixed income indices © 2024 FTSE Fixed Income LLC. All rights reserved. S&P data © 2024 S&P Dow Jones Indices LLC, a division of S&P Global. All rights reserved.
Indices are not available for direct investment. Their performance does not reflect the expenses associated with management of an actual portfolio. US-domiciled mutual funds and US-domiciled ETFs are not generally available for distribution outside the US.
Working with an Advisor
Avoiding these mistakes can improve the odds of reaching your long-term investment goals. But, as a do-it-yourself investor, you’ll have to manage the challenge alone. A qualified financial advisor can offer deeper expertise and insights that lead to better financial habits.
But the potential benefits go beyond just helping you avoid a bad decision. An advisor can design a diversified, research-backed investment strategy based on your long-term goals and comfort level with risk. Equally important, you can look to a seasoned professional for guidance through different markets. By walking with you on the journey, an advisor can encourage the discipline essential to building wealth over time.
(O’Reilly Wealth Advisors adds this paragraph.) As your advisor, we use DFA extensively because the data shows that the majority of their funds, the majority of the time outperform their benchmarks over 20 years. (You need 20 years to make a statistically significant conclusion because of the statistical noise in market return data.) Reach out to us if you would like to see the data!
DISCLOSURES
This information is intended for educational purposes and should not be considered a recommendation to buy or sell a particular security. Named securities may be held in accounts managed by Dimensional.
Fama/French Total US Market Research Index: The value-weighted US market index is constructed every month using all issues listed on the NYSE, AMEX, or Nasdaq with available outstanding shares and valid prices for that month and the month before. Exclusion: American depositary receipts. Source: CRSP for value-weighted US market return. Rebalancing: monthly. Dividends: reinvested in the paying company until the portfolio is rebalanced.
The Fama/French indices represent academic concepts that may be used in portfolio construction and are not available for direct investment or for use as a benchmark. Index returns are not representative of actual portfolios and do not reflect costs and fees associated with an actual investment.
Results shown during periods prior to each Index’s index inception date do not represent actual returns of the respective index. Other periods selected may have different results, including losses. Backtested index performance is hypothetical and is provided for informational purposes only to indicate historical performance had the index been calculated over the relevant time periods. Backtested performance results assume the reinvestment of dividends and capital gains.
Eugene Fama and Ken French are members of the Board of Directors of the general partner of, and provide consulting services to, Dimensional Fund Advisors LP.
Risks include loss of principal and fluctuating value. Investment value will fluctuate, and shares, when redeemed, may be worth more or less than their original cost. Diversification does not eliminate the risk of market loss.
Find an Advisor tool for informational purposes only.
Dimensional makes no representation as to the suitability of any advisor, and we do not endorse, recommend, or guarantee the services of any advisor.
Individuals should carefully evaluate any advisor whom they may consider hiring. Individuals are responsible for monitoring their advisor’s investment performance.